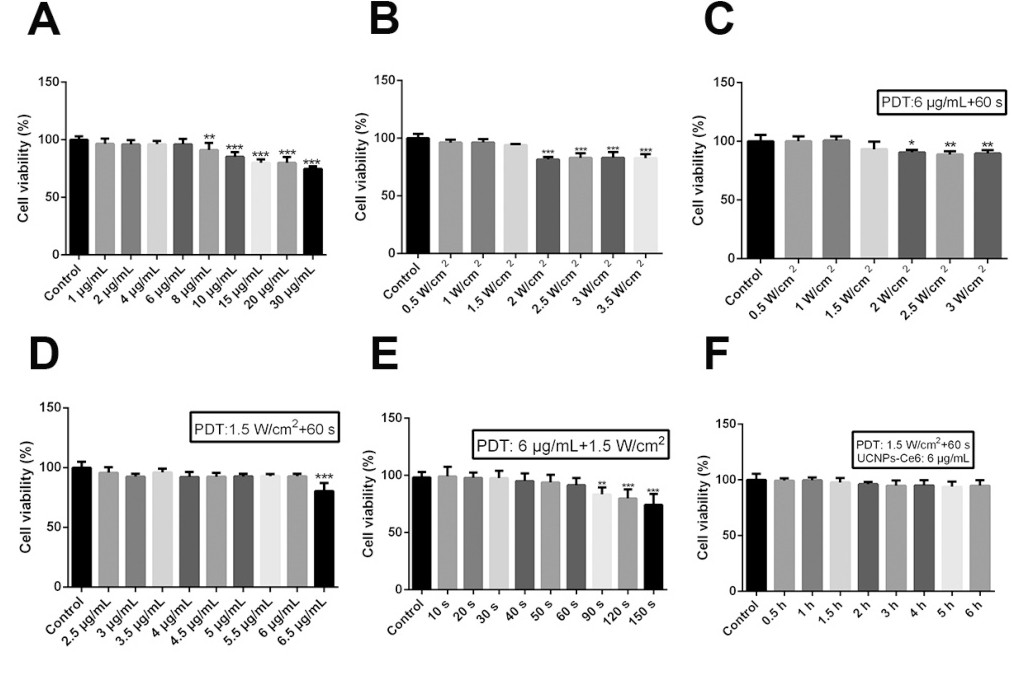
Fig. 2. Survival rates of M1 peritoneal macrophages after PDT. The survival rates of M1 peritoneal macrophages (A) following exposure to different UCNPs-Ce6 concentrations for 4 h (n = 10). (B) following exposure to different laser densities at 60 s (n = 10). (C) following exposure to different laser densities at 6 µg/mL UCNPs-Ce6 and 60 s (n = 10). (D) following exposure to different UCNPs-Ce6 concentrations at 1.5 W/cm2 and 60 s (n = 10). (E) following exposure to different laser irradiation times at 1.5 W/cm2 and 6 µg/mL UCNPs-Ce6 (n = 10). (F) following exposure to 6 µg/mL UCNPs-Ce6, 1.5W/cm2 and 60 s (n = 10). * P<0.05, ** P<0.01, *** P<0.001 vs control group.